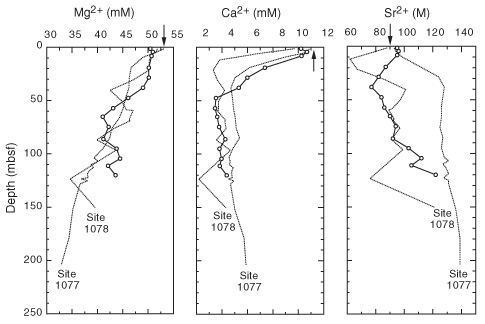
Figure 17. Downcore profiles of Ca2+, Mg2+, and Sr2+ at Site 1079 (solid lines with open circles). Arrows = mean ocean-bottom-water values taken from Millero and Sohn (1992). For comparison, profiles for Site 1077 (Congo Basin) and Site 1078 (Angola Basin) are also shown (dotted lines).