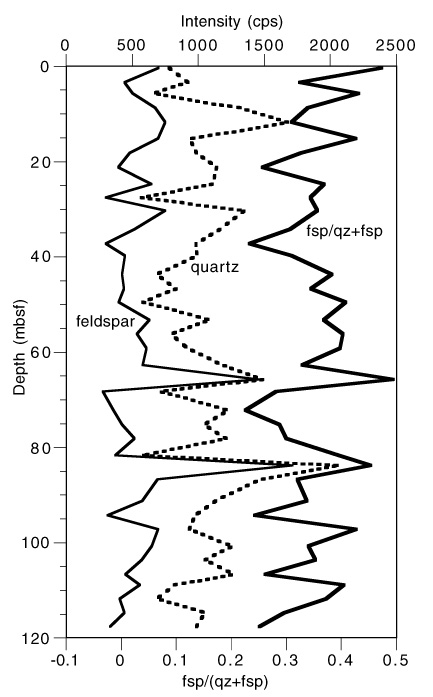
Figure 3.
Stratigraphic variation in the quartz and feldspar peak intensity (in counts per second [cps]) derived from the XRD patterns.