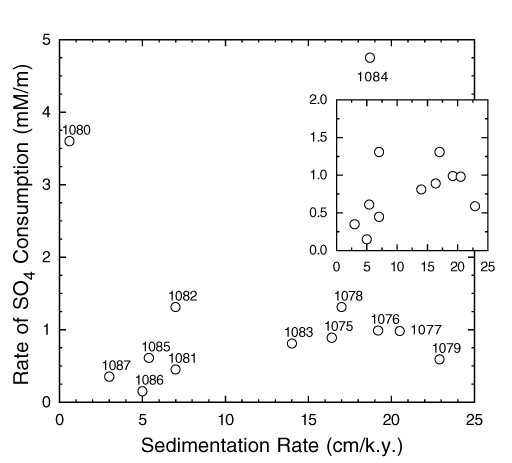
Figure 3. Sedimentation rate (cm/k.y.) plotted vs. the rate of dissolved SO42– consumption (mM/m) at all Leg 175 sites, including Site 1087. Inset shows an expanded view of the same plot without Sites 1080 and 1084, which plot away from the general pattern in the main panel.