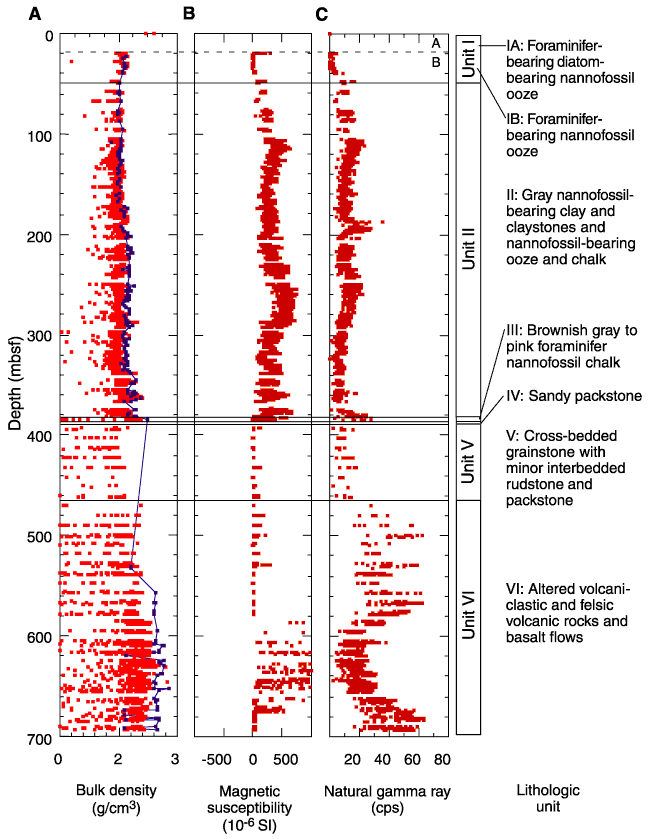
Figure
F92. Downhole
profiles of MST measurements along with discrete measurements. A.
GRAPE bulk density (red) and bulk density derived from discrete samples at Site
1139 (dots associated with solid line). B. Whole-core
measurements of magnetic susceptibility. C. Natural gamma ray.
Horizontal solid lines separates the lithologic units, and the dashed line shows
the boundary between Subunits IA and IB. Lithologic units are shown to the
right.


![]()