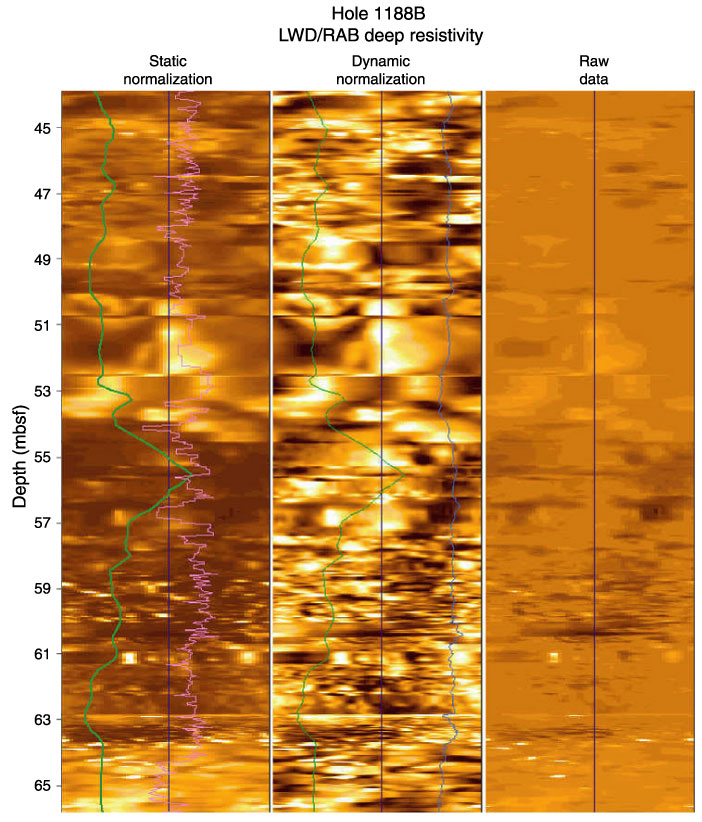
Figure F142. Images of the deep resistivity from the resistivity-at-the-bit (RAB) tool. Light colors correspond to resistive features, dark colors to conductive ones. All images are oriented toward the north. The figure shows three different ways of image processing. The left column shows an image from static processing, using 32 colors. The assignment of colors to resistivity values is valid for the entire hole. The column in the middle gives the result of dynamic processing with 32 colors. The assignment of colors to resistivity is changed within a sliding window. The right column shows the image of the raw data. The green line (low frequency fluctuation) in the static and dynamic column gives the gamma ray. The pink image (high frequency fluctuation) in the static window corresponds to the rotation of the bit, and the blue curve (high frequency fluctuation) in the dynamic image is a resistivity log.
![]()